

The 8,800-Job Question: The Toyota Expansion
What Toyota's $3.6 Billion Expansion Actually Demands From San Antonio, and Why the Answer Takes Twenty Years
An Applied Real Estate Institute Research Report
Analysis by Will Curtis, Applied Real Estate Institute
July 14, 2026
Click to Download the PDF of this report.
Key Findings
● The realistic number is about 8,800 jobs, not 30,000. Under the federal government's own regional multiplier (BEA RIMS II), Toyota's 2,000 direct jobs support roughly 8,800 total jobs across the metro. The widely cited 30,000 figure is a gross, all-in count over a decade or more; it answers a different question than “how much recurring demand does this create.”
● It creates demand for roughly 7,800 housing units at the federal benchmark, equal to about 78 percent of every home currently listed for sale in the San Antonio metro, concentrated in the workforce-to-mid-move-up price band (roughly $250,000 to $375,000) rather than the luxury end.
● The demand is real but slow. Based on the 2003 Toyota plant's own twenty-year track record on the same site, this demand phases in over the better part of a decade or two, not two or three years. This is a long-hold story, not a land rush.
● The demand disperses across the metro, not toward the plant. U.S. Census data shows 82 percent of current Toyota campus workers live in the northern half of the metro, while the plant sits on the far South Side. More than 70 percent live 10 or more miles away. Betting on land nearest the plant misreads where the workforce actually settles.
● Industrial supply is adequate; the pressure is on housing and retail. The metro's roughly 20 million square feet of vacant industrial space absorbs the supplier demand. Housing and, in tighter scenarios, retail are where the demand outruns the current pipeline.
● Most of the sales tax leaves town. Of the sales tax the new households generate, only about $3.4 million a year stays local at the federal benchmark; roughly $10.7 million flows to the State of Texas. Recurring property tax, about $58 million a year, is the larger and more locally retained stream.
● The nearest school districts are shrinking, not growing. Southwest ISD, where the plant sits, closed an elementary school in 2025 amid declining enrollment and a budget deficit. Because the induced demand arrives slowly and lands north, the districts making hard capacity decisions today may not be the ones that capture the eventual growth.
Two numbers, two different questions
On July 6, San Antonio got the kind of headline economic developers chase for entire careers. Toyota confirmed a $3.6 billion expansion of its South Side campus: a second assembly line for the Tacoma, 2.5 million square feet, 2,000 new jobs, and a plant that doubles in size by 2030.
Two numbers have anchored the coverage since: the 2,000 direct jobs Toyota announced, and the roughly 30,000 total jobs local leaders have cited. Both are real, but they answer different questions, and neither one is the number you would use to plan a subdivision, a retail center, or a school budget.
That is the gap this report fills. Two thousand factory jobs do not stay 2,000 jobs, and the 30,000 figure counts something much broader than recurring local employment. The number a developer or a planner actually needs sits in between, and it depends entirely on which economic multiplier you trust. The Applied Real Estate Institute built a model to estimate it from the actual San Antonio-New Braunfels metro data. This report shows the work, including where the answer is uncertain and what the different published figures each really measure.
Here is the short version. Under the federal government's own regional multiplier, the expansion supports roughly 8,800 total jobs and demand for about 7,800 housing units across the metro. That is a serious number. It is also a number that arrives over roughly two decades, disperses across the whole metro rather than the neighborhoods next to the plant, and concentrates in a specific price band rather than a specific place. Each of those three qualifiers changes what a rational operator should do with it, and each is documented below.
Why we show three answers instead of one
Most impact reports hand you a single big number and hope you do not ask where it came from. We think that is backwards. The multiplier, meaning how many total jobs each direct factory job ultimately supports, is the single most consequential assumption in the entire analysis, and serious analysts genuinely disagree about it. So we ran three, and we label what each assumes.
The conservative floor (2.6x). Economist Enrico Moretti's peer-reviewed research on local multipliers (American Economic Review, 2010) found each new U.S. manufacturing job supports roughly 1.6 additional local service jobs, about 2.6 total. This is the number an academic skeptic would hold us to. It anchors the low end.
The federal benchmark (4.41x). The Bureau of Economic Analysis publishes RIMS II regional input-output multipliers, the same class of model behind most professional impact studies. AREI purchased the current BEA table for the San Antonio-New Braunfels MSA, built on 2017 national benchmark data and 2024 regional data, and applied the Type II direct-effect employment multiplier for light truck and utility vehicle manufacturing, which is the Tacoma's exact industry code. That multiplier is 4.41. This is our headline.
The economic-base ceiling (10.93x). The location-quotient method taught in the CCIM Institute's CI 102 curriculum, computed from 2024 employment data for the eight-county MSA. It produces a multiplier of 10.93. We report it for completeness and treat it as a ceiling, because location-quotient methods systematically overcount in large, diversified metros. We would not stake a claim on it, but it usefully brackets the top of the plausible range.
Here is what those three produce, starting from Toyota's 2,000 jobs and the demographics of the actual metro (2.30 residents per job, 2.7 people per household, per 2024 BLS and Census data):

It is worth placing the widely cited 30,000 figure in this range. It sits above even our economic-base ceiling, which we already treat as the top of the plausible band. That is because it answers a different question: it is a gross, all-in count that typically includes construction jobs, temporary positions, and every tangentially related hire accumulated across a decade or more. That is a legitimate way to describe the total activity a project touches over time. It is simply not the same measure as recurring, supportable employment. Read the 30,000 as the broadest cumulative headline number, and read the roughly 8,800 as the figure to plan recurring real estate and public-service demand around.
The 2003 precedent: what the first plant actually did
What makes this expansion easier to reason about than most is that San Antonio has done it before, on the same site, starting from almost the same number.
Toyota broke ground on the South Side in 2003 and began production in 2006 with roughly 2,000 direct jobs, the identical figure to today's announcement. The land was, in the words of the plant's own president, nothing but scrub brush. Two decades later, at Toyota's 20-year anniversary in 2023, Toyota Texas President Kevin Voelkel described the campus as 9,400 people.
That growth is worth understanding for what it is, and being careful about what it is not. The 9,400 figure describes the on-campus workforce, Toyota employees plus the suppliers physically located on the Toyota Texas campus. It is not a measure of total regional employment supported by the plant, and it should not be read as a clean multiplier. Campus headcount grew over twenty years because Toyota added product lines and drew suppliers on-site, which is a different thing from the indirect and induced jobs a regional multiplier counts across the whole metro. We mention the number because it shows the scale of what one plant set in motion, not because the arithmetic validates any particular multiplier.
What the precedent does establish, qualitatively, is that the mechanism is real and large. Toyota's arrival pulled in a supplier and manufacturing base that did not exist before: Navistar's commercial truck plant, Aisin's transmission facility, JCB's equipment plant. By the 20-year mark the campus supported roughly 3,200 to 3,700 direct Toyota workers plus about 4,000 more at 23 on-site suppliers, and a wider ecosystem of off-campus suppliers and services grew up around it. The indirect and induced effects were not theoretical. They showed up as real employers with real addresses. That is the pattern this expansion is likely to repeat: a genuine, multi-decade regional ripple. How large, and how fast, is what the rest of this report estimates, and it rests on the BEA benchmark rather than on the 2003 headcount.
Where the workers actually live: the finding that changes everything
Here is where the popular story breaks, and where the most important evidence in this report comes in.
The reflexive assumption is that a South Side plant fills South Side neighborhoods. It does not. We tested this directly using the U.S. Census Bureau's OnTheMap tool, which links workers at a given site to the census blocks where they live. Drawing a tight boundary around the Toyota campus and pulling the residential distribution of the roughly 9,146 people who work there produces a clear and counterintuitive result.
Figure 1: Where Toyota Texas campus workers live
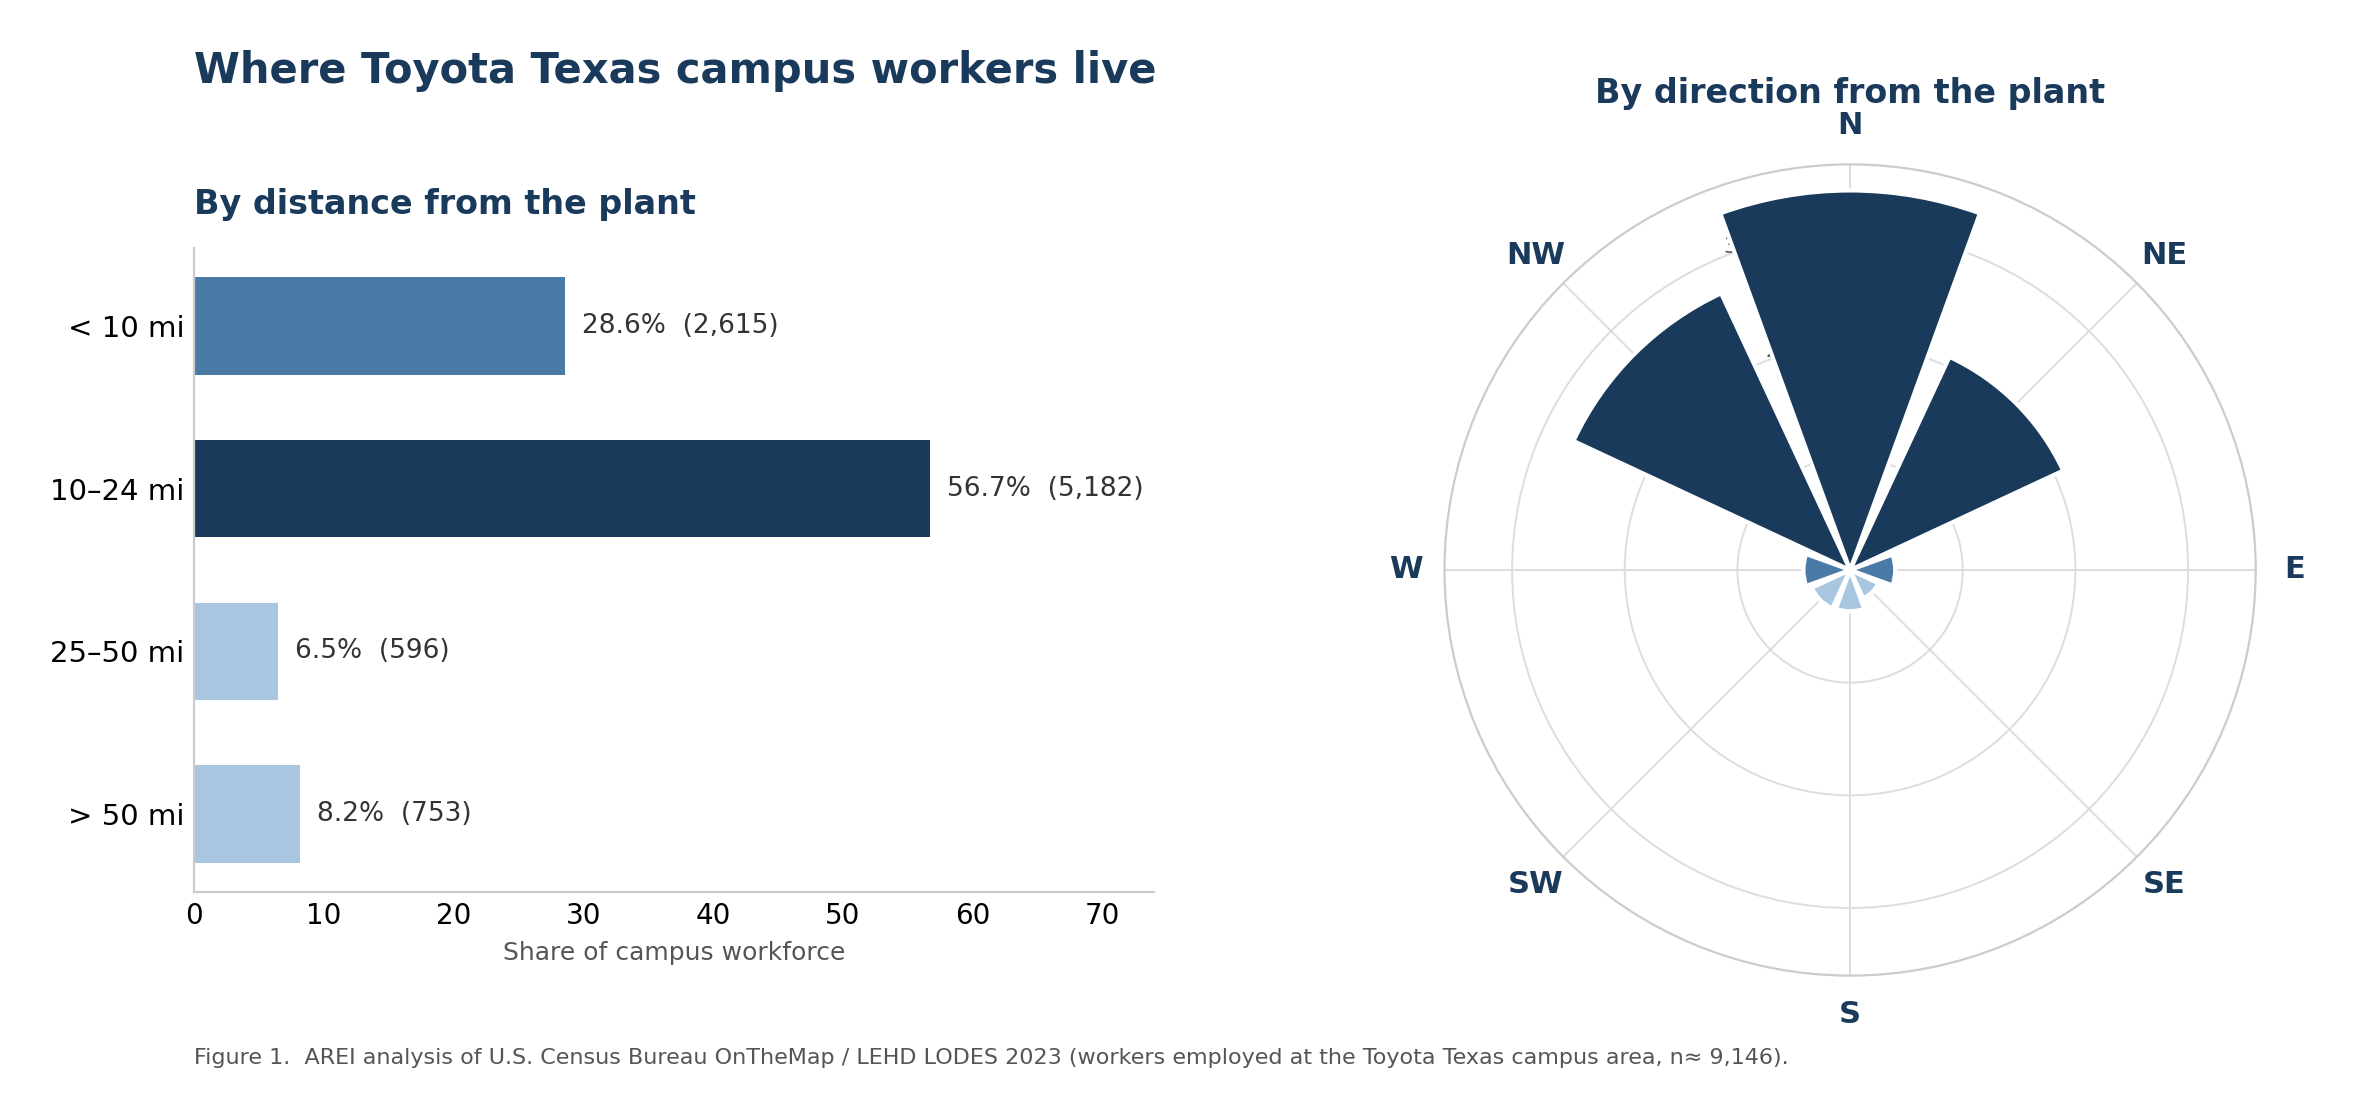
Figure 1. AREI analysis of U.S. Census Bureau OnTheMap / LEHD LODES 2023 data (workers employed at the Toyota Texas campus area, n≈9,146). Distance bands at left; directional distribution at right.
The same finding in tabular form:
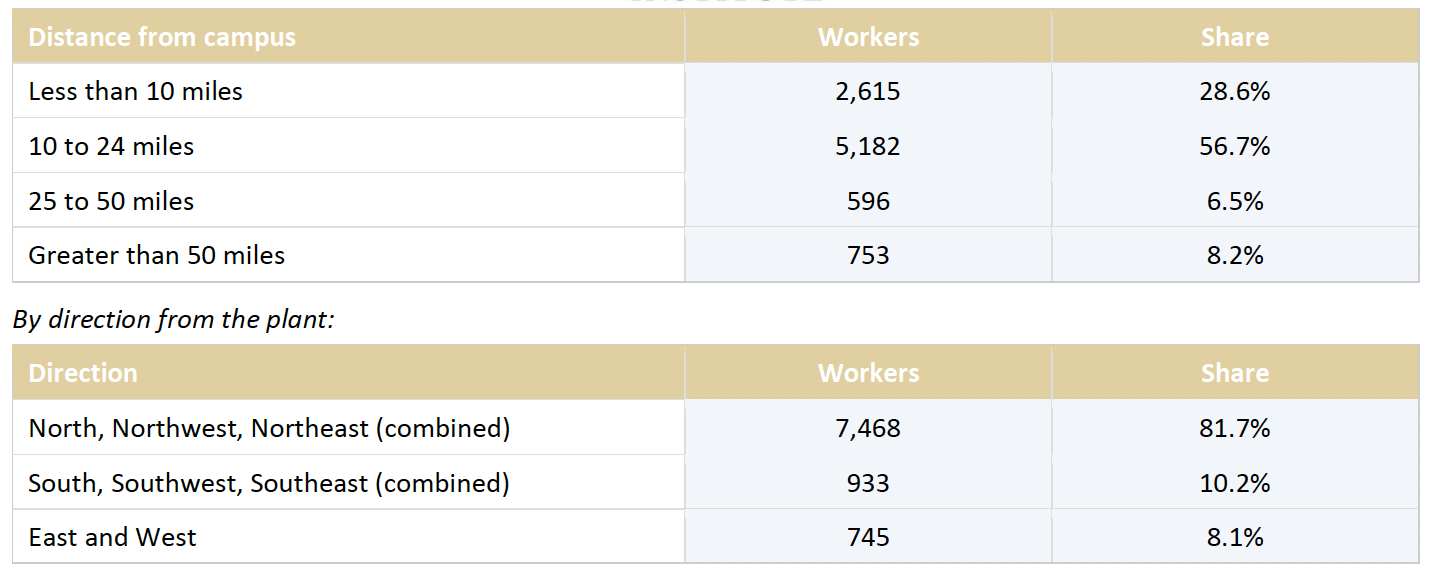
Two facts jump out. First, more than 70 percent of the campus workforce lives 10 or more miles from the plant. Second, and more striking, better than 80 percent live in the northern half of the metro, while the entire southern half, the side the plant physically sits on, houses barely 10 percent of the workers.
The plant is on the far South Side. Its workforce lives up and out, toward central, north, and northwest San Antonio and the suburbs along that arc. Two decades after Toyota arrived, its own employees voted with their home addresses, and they voted north.
One honest nuance, because we read the whole dataset and not just the headline. Among the small minority who do live near the plant, they cluster tightly: to the southeast of the campus, 62 percent of that group lives within 10 miles, and to the southwest, 47 percent do. So the true pattern is barbell-shaped, a small, tight cluster of nearby workers on the plant's own side, and a large majority living far away to the north. That nuance matters for anyone reading a demand map, but it does not change the core finding: this is a metro-wide workforce, not a South Side one.
What this means: plan for a decade, plan for the metro, not the plant
That evidence sets up the central finding of this report, and it runs against the grain of the excitement in three specific ways.
The demand is real. Our federal benchmark says the expansion ultimately supports demand for roughly 7,800 housing units and 1.4 million square feet of industrial space across the metro. That is a genuine, quantifiable pull on the market.
The demand is slow. If the first Toyota plant is any guide, and it is the best guide we have, this demand phases in across the better part of a decade or two as the second line ramps, suppliers expand, Tacoma production transitions from Baja California through 2030, and workers gradually settle. The housing and retail response to the 2003 plant did not arrive in two or three years. It built over the better part of twenty.
The demand is dispersed. As Figure 1 shows, it does not bank into the neighborhoods nearest the plant. It spreads across the metro and weights north.
Put those together and the rational move is not what the announcement excitement suggests. This is not a signal to break ground on spec inventory tomorrow against a two-year absorption assumption, and it is not a signal to overpay for dirt next to the plant on the theory that proximity captures the demand. The current for-sale market is already balanced-to-buyer-leaning, with 5.2 months of supply and a median price of $289,990. The apartment market is carrying real slack at 15.9 percent vacancy. Dumping product into either on a near-term Toyota thesis is how you end up carrying inventory.
So what does a disciplined operator actually do with this? Accumulate position where the metro is genuinely growing, not solely where the plant sits. Secure entitlements and build optionality rather than committing to spec delivery on an announcement timeline. Underwrite to a decade-plus absorption, not a two-year pop. Target the price band the demand actually lands in, covered in the next section, rather than a specific ZIP code. The winners from the 2003 plant were not the people who overbuilt in 2007 or who bet everything on the parcels closest to the gate. They were the people who held developable position across the growth path of the metro and delivered into demand as it actually showed up.
The workforce, and the price band the demand lands in
Geography is only half the picture. Price is the other half, and here the data points somewhere specific even though the location does not.
Toyota's recently reported production wages start around $20.54 an hour, with an average salary near $68,000 and some six-figure senior roles. Against the metro's average wage of roughly $28.58 an hour, the entry rung of Toyota production actually starts below the metro average on an hourly basis. But the average Toyota salary of about $68,000 lands above the metro's average individual wage and near the metro median household income of $76,213. The worker-education profile confirms the blue-collar tilt: among campus workers, roughly 45 percent have a high school education or less, and only about 11 percent hold a bachelor's degree or higher.
The honest read cuts both ways, and both matter. These are solid single-earner wages by local standards, good enough to get a household into or near the metro median on one income. They are not luxury-buyer wages. So the housing demand these jobs create concentrates in the workforce-to-mid-move-up band, call it roughly $250,000 to $375,000 against a $289,990 median, plus a meaningful rental and attainable-ownership component driven by the below-average entry wages.
That is the useful synthesis for a builder or investor: the demand disperses across the metro geographically, but it concentrates by price in exactly the affordable-to-mid tier that already has the least slack. The location is anywhere the metro grows. The price point is identifiable, and it is the segment hardest to satisfy today.
Housing: real demand, patient timing, dispersed geography
Housing is the clearest story in this analysis, and it holds up at every multiplier.

Even the conservative floor generates demand for 4,623 housing units, equal to roughly 46 percent of every home currently listed for sale in the entire San Antonio MSA. At the federal benchmark, that demand of 7,843 units equals about 78 percent of all active listings. These are metro-wide figures, and they arrive over years, but the scale is real: this single expansion, at the benchmark, calls for close to a full year's worth of the metro's current for-sale inventory.
The market it lands in: 10,029 active listings, 5.2 months of supply, a median price of $289,990, and a rental side running 4,589 apartment units under construction against a 15.9 percent multifamily vacancy rate (CoStar 2026 Q1; SABOR InfoSparks, May 2026). That elevated apartment vacancy is worth flagging honestly. The rental market has current slack, which reinforces the patience thesis on the multifamily side specifically. This demand is real, but it is not a reason to accelerate delivery into a market that is presently soft.
Industrial: the segment that is already covered
Analysts earn trust by saying what the data says even when it is dull, so here it is plainly: San Antonio's industrial pipeline has this covered, with room to spare.
The expansion generates demand for roughly 811,000 to 1.4 million square feet of industrial space across our scenarios, driven by suppliers and logistics. One clarification matters here, because it is easy to get wrong. The metro's current pipeline, about 4.5 million square feet under construction as of CoStar's 2026 Q1 data, predates this announcement. It was built for pre-Toyota demand from everything else in the region, so Toyota's supplier needs are largely additive on top of it, not already contained within it. Anyone claiming the pipeline has already absorbed Toyota is misreading the timing; the market has not yet reacted, and Toyota's own on-campus construction, including the $531 million rear-axle plant and the 2.5 million square feet of the expansion itself, is a separate direct footprint that Toyota is building for itself.
Even so, the supply picture is comfortable, for a different and more defensible reason than a pipeline that has not yet responded. The metro carries roughly 194 million square feet of existing inventory at about 10.5 percent vacancy, which is on the order of 20 million square feet sitting empty today. Even treating Toyota's supplier demand as fully additive, there is substantial existing slack to absorb it before new speculative construction is required. Add the mature supplier ecosystem the first plant created, the 23 on-site suppliers plus the Navistar-Aisin-JCB cluster, and the region is structurally better prepared than it was in 2003.
The honest read: this is not where the shortage is, but not because the pipeline pre-absorbed it. It is the existing vacancy that provides the cushion. Watch industrial for absorption speed and for build-to-suit opportunities tied to specific named suppliers, not for a broad supply gap.
Retail: follows the rooftops, wherever they land
Retail demand follows residents, not factory gates, because new households spend near where they live. And because those households disperse across the metro, retail demand disperses with them.
The model translates the benchmark's 20,262 new residents into roughly 1.2 million square feet of supportable retail, against just 843,000 square feet under construction in a market already tight at 3.8 percent retail vacancy (CoStar 2026 Q1). The scenarios diverge in an instructive way: at the conservative multiplier, retail demand slightly undershoots what the current pipeline covers, while at the federal benchmark and above it overshoots, and in an already-tight retail market that gap gets felt. Retail is the one property type where the answer genuinely flips depending on which scenario holds, and where a tight starting vacancy means even moderate new demand shows up quickly.
But the same discipline applies as everywhere else in this report: this is metro-wide, rooftop-following demand that builds over years, distributed across wherever the new households actually settle, which the evidence says is broadly and to the north. It is not a concentrated South Side retail play.
Office: a footnote, honestly
A truck plant is not an office story, and we are not going to pretend otherwise.
The multiplier does generate some office-using demand, roughly 380,000 to 645,000 square feet across scenarios, as indirect and induced employment lands partly in professional services, finance, and administration. But we hold this number loosely, and you should too. The model assumes new jobs distribute across property types at the metro-wide sector average, and manufacturing-driven growth almost certainly skews more industrial and blue-collar than that average, which means the true office demand is likely lower than the figure above. We disclose that assumption rather than lead with a number we half-trust. Office gets a mention here because intellectual honesty requires acknowledging the effect exists. It does not get a headline.
The tax bill, and the incentive math
New development and new households generate two distinct streams of public revenue: recurring property (ad valorem) tax on the buildings, and sales tax on what the households spend. We separate them here rather than blending them, because they flow to different places and a reader deserves to see which is which.
Ad valorem (property) tax. Applying the Bexar-area blended rate of 2.3 percent (before homestead exemptions) to the new assessed value the development creates:

Sales tax. Each new household spends locally. We estimate taxable spending per household as the metro median household income of $76,213 times a 30 percent taxable share (Texas exempts most groceries, rent, and services), or about $22,864 in taxable purchases per household per year. San Antonio's 8.25 percent sales tax splits into a 6.25 percent State of Texas portion and a 2.0 percent local portion. The local 2.0 percent is itself the City of San Antonio's share (1.125 percent), plus VIA Metropolitan Transit, the regional transit authority (0.50 percent), plus the Advanced Transportation District, which funds local mobility and transportation projects (0.375 percent). Bexar County levies no separate sales tax here. That produces about $1,886 in total sales tax per household per year, of which roughly $457 stays local and about $1,429 goes to the State.
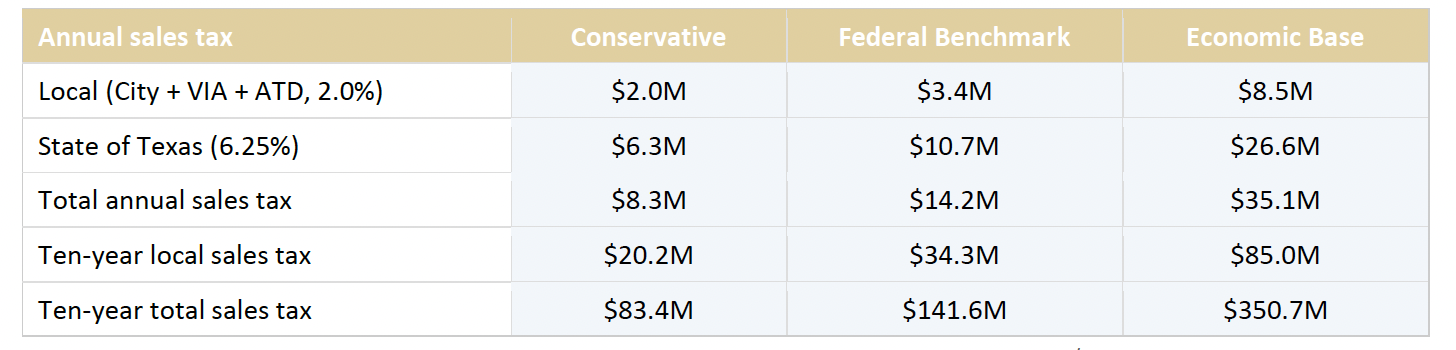
The split matters. Of the sales tax this expansion generates at the federal benchmark, roughly $10.7 million a year flows to Austin and only about $3.4 million stays in the San Antonio region.
Combined recurring revenue. Adding the ad valorem and total sales tax streams, the expansion generates roughly $42.7 million (conservative), $72.6 million (federal benchmark), or $179.9 million (economic base) in total annual tax revenue across all levels of government, with the property tax the larger share in every scenario.
Set that against the incentives. San Antonio approved a package reported at more than $122 million, Bexar County added nearly $56 million, and the state layered on a $20 million Texas Enterprise Fund grant plus JETI program support. Call the combined local-and-state commitment somewhere north of $178 million. At the federal benchmark, the roughly $72.6 million in total annual recurring tax revenue from induced development recovers that combined public outlay in about two and a half years, before counting the $3.2 billion construction-phase impact the city projects. One caution on that framing: the incentives and the revenue are not all borne by or returned to the same government, since much of the sales tax portion flows to the State. Read the payback as a whole-of-government figure, not a city-only one.
That is the arithmetic incentives should be judged against, in both directions. It is a genuinely favorable ratio. It also depends on the demand actually materializing, and on the phasing being patient, which loops back to this report's central point: the return is real but it accrues over a decade-plus, not a budget cycle.
One honesty note, expanded in the limitations. The 2.3 percent property rate is applied before homestead exemptions, so residential collections will run somewhat below the ad valorem figures shown. The sales tax figures above are already separated into their local and state shares, so no adjustment is needed there.
Beyond real estate: the schools problem nobody is naming
At the federal benchmark, the household cascade implies real pressure on systems that plan on long lead times: several thousand additional school-age children, thousands of additional vehicles, and meaningful new daily traffic load, all spread across the metro rather than concentrated in one place.
But there is a harder story here, and it is the opposite of the one the celebratory coverage tells. The school districts nearest the plant are not straining against a flood of new students. They are shrinking. Southwest ISD, the district the plant sits in, closed Sky Harbour Elementary in 2025 to address a deficit and declining enrollment, and is running a projected multi-million-dollar shortfall. South San ISD lost roughly 400 students in a single year, a roughly $3 million hit. Districts across the area are passing deficit budgets and cutting positions, driven by a mix of demographic shifts and school-funding structures that have not kept pace.
That creates a genuine structural mismatch, and it is worth naming plainly because no press release will. The induced demand from Toyota arrives slowly, over a decade or more, and disperses across the metro, weighted north, away from the South Side districts nearest the plant. Meanwhile those very districts are making hard, often irreversible decisions now, closing and consolidating campuses, based on today's declining enrollment. A district that right-sizes down in 2025 and needs that capacity back in 2035 has made an expensive mistake, and rebuilding capacity is far slower and costlier than holding it. The growth and the need are separated by both time and geography. Texas school funding is enrollment-driven and lagged, but capacity planning requires long lead times, and dispersed, slow-arriving demand is exactly the pattern that is hardest for any single district to plan around.
This is not a criticism of the districts or of Toyota. It is a structural observation that local planners, on both the school and transportation sides, should be modeling now rather than in 2029.
What I would tell a client
“You'd instinctively think most employees would live near the plant to be close to work. But two decades after Toyota entered this market, the data says otherwise. Some do live nearby, but far more spread across the metro. You could argue that early on it was a lack of housing near the plant, and that's logical, but if proximity really drove the decision, we'd have seen workers move back toward the plant as housing got built. We didn't. That doesn't mean new employees won't choose to live close, they might, but if history tells us anything, we'll see a similar dispersal. Land near the plant will gain value from demand and proximity, but this is likely a long hold, the same way it was the first time Toyota built here.”
Will Curtis CCIM, CPM, Applied Real Estate Institute
Methodology, sources, and known limitations
Method. Economic-base demand cascade per CCIM Institute CI 102, run under three employment-multiplier scenarios: Moretti (2010, American Economic Review); BEA RIMS II Type II direct-effect employment multiplier for light truck and utility vehicle manufacturing (NAICS 336112), San Antonio-New Braunfels MSA (purchased dataset, 2017 national benchmark, 2024 regional data); and a location-quotient economic-base multiplier computed from 2024 BLS employment data for the eight-county MSA. Direct jobs (2,000) are treated as basic (export) employment, valid because vehicle production sells nationally. Worker residence distribution from U.S. Census Bureau OnTheMap / LEHD Origin-Destination Employment Statistics, LODES vintage 8.4, 2023 data year.
Data sources. BLS QCEW 2024 annual averages, all eight MSA counties aggregated; Census ACS (population, household size, tenure, vacancy, units in structure, MSA geography); CoStar 2026 Q1 (office, industrial, retail, multifamily); SABOR InfoSparks May 2026 (single-family metrics); BEA RIMS II 2025-26 release; Census OnTheMap / LEHD LODES 2023 (worker residence); BLS Occupational Employment and Wage Statistics (metro wages); historical context from Toyota Motor North America, greater:SATX, and San Antonio Report, KSAT, TPR, and San Antonio Business Journal reporting, 2003-2026.
Known limitations.
1. The economic-base scenario (10.93x) is a ceiling; location-quotient methods overcount in diversified metros. We lead with the federal benchmark (4.41x), independently corroborated by the 2003 plant's observed ~4.7x campus growth over twenty years.
2. Demand phases in over an extended period, likely a decade or more based on the 2003 precedent, not a single year. All totals are cumulative, not immediate.
3. The jobs-to-residents conversion assumes net-new residents fill each job; because some positions go to existing residents and in-commuters, resident, household, and housing figures are ceilings on the true net-new demand.
4. Worker residence data (Figure 1) reflects the existing campus workforce as of 2023 and is the best available predictor of future settlement, but new Tacoma-line workers could settle differently.
5. Commercial space demand assumes new employment distributes across property types at the metro-wide sector average; actual manufacturing-driven growth likely skews more industrial and less office, so the office figure in particular is held loosely.
6. Property tax applies a Bexar-area blended 2.3 percent rate before homestead exemptions, with market prices proxying assessed values; the eight-county MSA contains varying local rates.
7. Sales tax figures use the combined 8.25 percent rate; the locally retained share is roughly 2 percentage points, the remainder going to the State of Texas.
8. Rental valuation blends single-family and multifamily unit values using the ACS renter split; for-sale valuation uses the InfoSparks resale median, and new construction typically prices higher, making estimates conservative.
9. Housing pipeline comparisons mix flow and stock measures; gap signals are directional, not unit-precise.
10. All inputs are San Antonio-New Braunfels MSA basis, 2024-2026 vintages.
About the Applied Real Estate Institute. AREI produces data-driven market research on the San Antonio region, built on public federal datasets and fully disclosed methodology. Analysis by Will Curtis, principal of AREI and broker at Crossed Sabers Commercial Real Estate.
Media inquiries: will@crossedsaberscre.com Full methodology documentation, source citations, and scenario assumptions are available to journalists on request, and AREI will walk any reporter or fact-checker through the calculation behind any specific figure. The underlying model incorporates licensed CoStar and SABOR data and is not distributed.